In the DevOps world, automation, collaboration, and continuous integration are key principles. Architecture diagrams play a crucial role in visualizing the pipelines, processes, and infrastructure that support DevOps workflows.
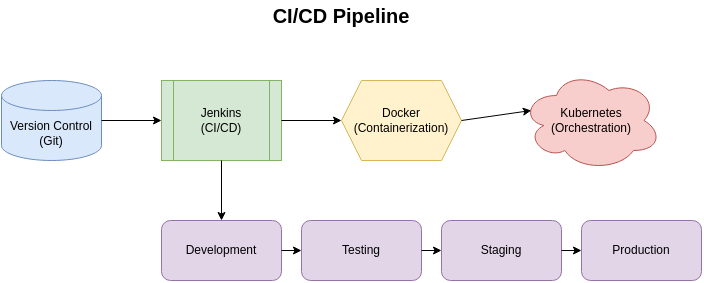
1. Visualizing CI/CD Pipelines with Diagrams
Continuous Integration and Continuous Deployment (CI/CD) pipelines are fundamental in modern software development. An architecture diagram can help DevOps teams understand the flow of code from commit to production.

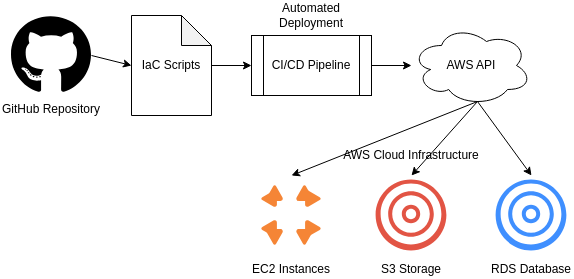
2. Mapping Infrastructure as Code (IaC) with Visual Tools
Infrastructure as Code (IaC) is a core DevOps practice. Using diagrams to map out infrastructure deployments helps teams visualize the infrastructure and how automation scripts (e.g., Terraform, Ansible) deploy services across cloud environments.

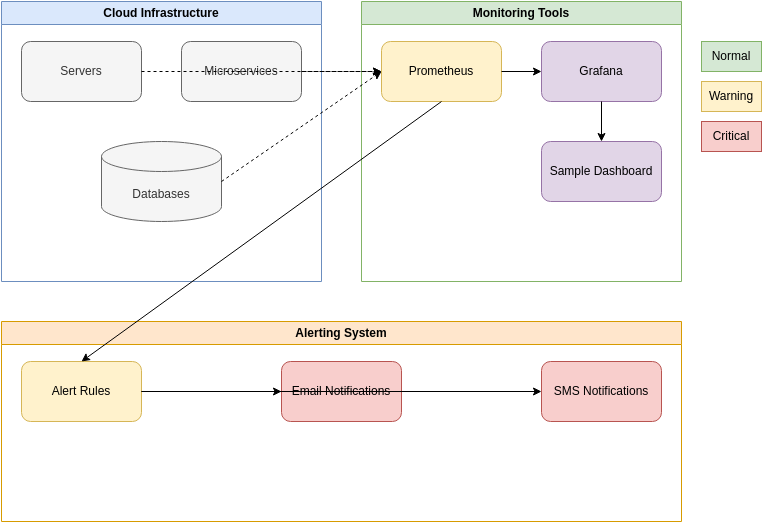
3. DevOps Monitoring and Incident Response: A Visual Guide
DevOps is also about monitoring and incident response. Diagrams can help teams visualize the system architecture and monitoring setup, enabling faster incident response and root-cause analysis.

Visualizing DevOps workflows with architecture diagrams can significantly enhance collaboration, communication, and automation.