A network diagram, or network map is an illustration of a computer network. It shows its parts and how they are linked. It functions as a model and provides a clear and succinct summary of the network’s structure. These maps help with efficient organization, troubleshooting, and documentation.
Network maps serve as essential resources for administrators and IT pros alike. They enable effective maintenance and serve as a benchmark to find possible bottlenecks or failure points. Also, they improve communication with coworkers and clients. It ensures everyone has a shared understanding of how the system is structured and operates.
In this article, we'll walk through the process of creating a network map. We will examine methods to explore various types of these maps, for example, physical and logical types. At the end of this guide, you will have the knowledge and skills to make a concise, informative, and engaging presentation.
Understanding Network Diagrams and Their Components
As we said before, a network diagram is an illustration of computer structures. It shows its components and how they are linked. It provides a clear and concise overview of the infrastructure. It makes it easier to understand, analyze, and troubleshoot.
There are primarily two main categories of maps. Let’s take a closer look at them:
- Physical. This network diagram example depicts the physical layout of tools. It includes their locations and links. This type shows the actual physical links between tools, for example, cables, fiber optic links, and wireless connections. Physical maps are essential for planning installations, maintenance, and troubleshooting.
- Logical. These ones focus on the logical organization of tools and their protocols. They show how tools communicate with each other regardless of their physical location. This type is useful for understanding system functionality, security, and work.
Network architecture diagram example typically has the next key elements:
- Nodes. They illustrate tools in the system, for example, computers, servers, routers, switches, and firewalls. They’re often depicted as boxes or icons.
- Connections. These represent the links between tools. It includes cables, wireless connections, and fiber optic links. They’re usually shown as lines or arrows.
- Tools. They are the specific components that make up the system, for example, routers, switches, servers, and workstations.
- Data Flows. Data flows mean the direction of data traffic between tools. They’re often shown as arrows on the links.
Here are some examples of infrastructure diagram scenarios:
- Small Office Network. A map of a small office system might show workstations linked to a switch. It is then linked to a router. The router provides internet access and connects the network to other networks.
- Enterprise Network. A map of an enterprise system might show many interconnected networks. It includes LANs, WANs, and DMZs. It might also include load balancers, firewalls, and intrusion detection systems.
- Cloud Infrastructure. A map of a cloud infrastructure might show virtual machines, storage, and network tools linked through a cloud provider's system.
Grasp the fundamental elements of a network map. Then, you can effectively visualize complex architectures. These maps are powerful tools for understanding the flow of data. They find potential bottlenecks and fix network issues. Through the analysis of those maps, you can gain valuable insights into the work, security, and scalability of a system.
You may be a network administrator, IT professional, or simply curious about techs. However, it really doesn’t matter. The ability to interpret and create network maps is an essential skill today. It can enhance your understanding of infrastructure and functionality.
Steps to Create an Effective Network Diagram

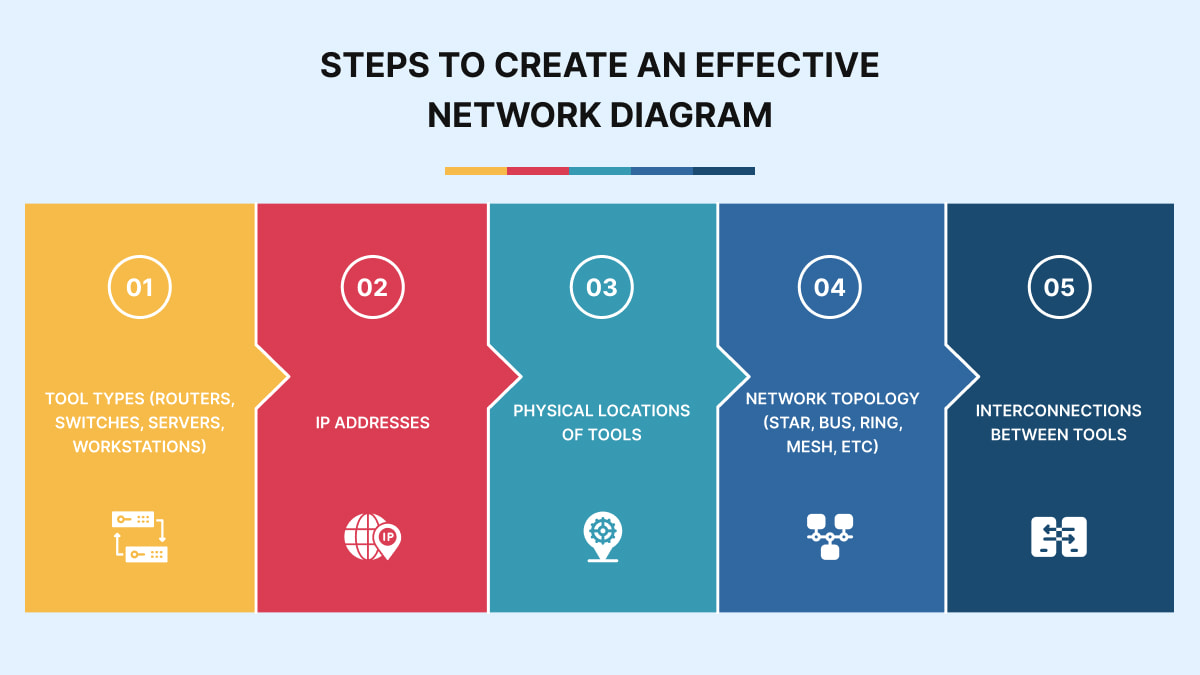
How to draw a network diagram? Before embarking on your process, you must get all the comprehensive info about your network system. This step ensures accuracy and clarity in your presentation. This detailed inventory will serve as the backbone of your network map. It will enable you to accurately show the flow of data and dependencies within your network. So, what are your steps? Start by finding key components. They’re:
- Tool types (routers, switches, servers, workstations)
- IP addresses
- Physical locations of tools
- Network topology (star, bus, ring, mesh, etc)
- Interconnections between tools
Choose the right map type. Pick the appropriate type. It must be based on your goals:
- Physical Map. This one shows the physical layout of tools and their links.
- Logical Map. This type shows the logical organization of network tools and their communication protocols.
Now, it’s high time for your internet infrastructure diagram’s design process. For this, you must follow the next steps:
- Plan the Layout. Decide on a suitable layout for your map. For example, top-down, left-to-right, or hierarchical. Consider the complexity of the network and the desired level of detail.
- Add Nodes. Show network tools as nodes (boxes or icons) on the map. Also, label each node with its name or IP address.
- Define Links. Draw lines or arrows between nodes to illustrate the links between tools. Use different line styles or colors to differentiate between different types of links (e.g., wired, wireless).
- Use Tools and Software. Use specialized software. For example, Visio, draw.io, or Lucidchart. They help create pro-looking network maps. These tools offer a variety of shapes, connectors, and templates. This helps to streamline the process.
However, no matter what plan you create, success depends on paying attention to the details. They are important to consider. Missing even a small detail can undo hours of work. So, what else must you consider? Here are some tips for clarity:
- Labeling. Clearly label all nodes and links to provide essential info, for example, include device names and IP addresses in your labels.
- Color Coding. Use color coding to distinguish different types of tools or links. For example, you might use blue for switches. Choose red for routers. And use green for workstations.
- Simplicity. Keep the map as simple as possible while conveying the necessary info. Avoid cluttering the map with excessive details.
- Consistency. Maintain consistency in the style, font, and color scheme. It must be throughout the entire map.
- Annotations. Add annotations or comments to explain specific details or highlight important aspects of the network.
Adhere to these guidelines and use these techniques. This will help you create a clear and reliable network map. They will significantly improve communication among team members. They can streamline troubleshooting processes and empower efficient network planning and control. Clear and accurate maps will not only prevent misunderstandings. They also serve as invaluable tools for finding potential vulnerabilities. With them, you can make informed decisions about future network expansions.
Tools and Best Practices for Network Diagrams

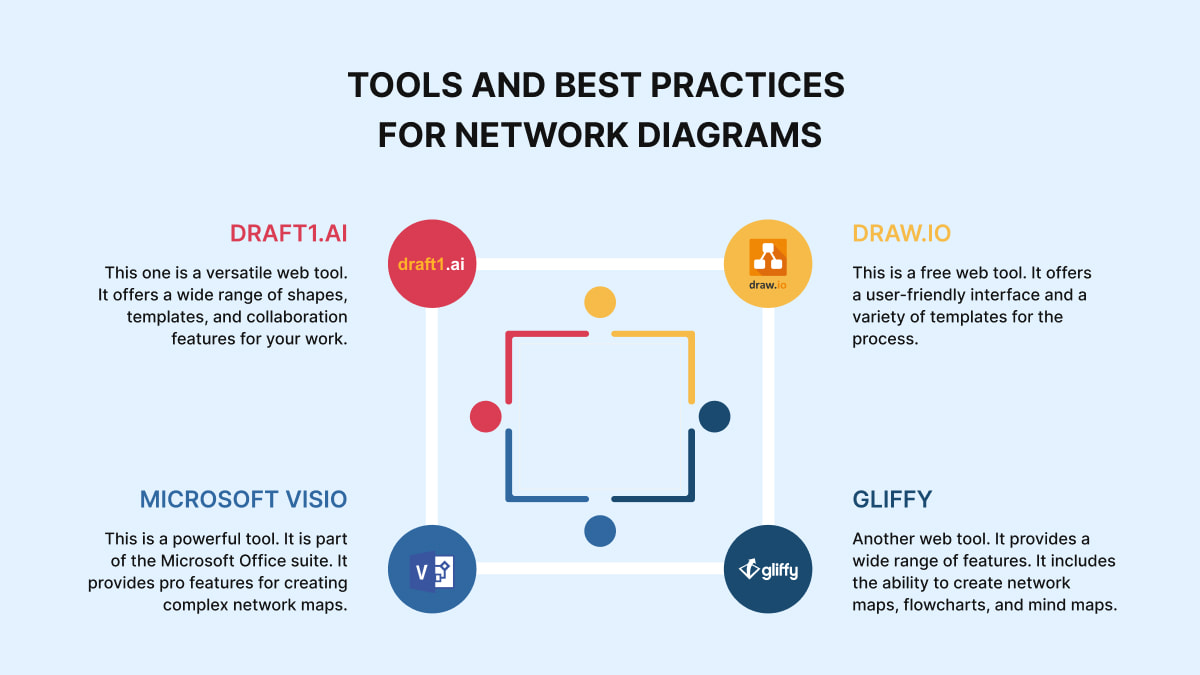
Making an effective network infrastructure diagram is essential for showing complex network infrastructures. These maps serve as valuable tools for planning, troubleshooting, and documentation. To enhance the creation process, many tools and software apps have been developed. So, what can you use for your work? Some of the most popular options are:
- Draft1.ai. This one is a versatile web tool. It offers a wide range of shapes, templates, and collaboration features for your work.
- Microsoft Visio. This is a powerful tool. It is part of the Microsoft Office suite. It provides pro features for creating complex network maps.
- Draw.io. This is a free web tool. It offers a user-friendly interface and a variety of templates for the process.
- Gliffy. Another web tool. It provides a wide range of features. It includes the ability to create network maps, flowcharts, and mind maps.
How to draw an effective network diagram? Consider the following best practices:
- Consistent Design. Maintain a consistent design style throughout the map. It includes font, color, and shape. This improves readability and professionalism.
- Frequent Updates. Keep your network map up-to-date as your infrastructure changes. This ensures accuracy. And it also prevents misunderstandings.
- Scalability. Design your maps to be scalable. It allows for future growth and changes. Use modular components. And avoid overly complex layouts.
- Clear Labeling. Label all nodes and links with clear and concise info. For example, device names, IP addresses, and data flow directions.
- Use of Symbols. Use standard symbols to illustrate different network tools and links. This improves clarity and consistency.
- Color Coding. Employ color coding to differentiate between different types of tools or links. This boosts visual appeal and understanding.
- Annotation. Add annotations or notes to explain specific details or highlight important aspects of the network.
- Version Control. Maintain many versions of your maps to track changes and facilitate comparisons.
How to use those maps? Infrastructure diagrams have many real-world uses. Here are some common uses:
- Network Planning. Visualizing the network’s current state and future growth plans.
- Troubleshooting. Finding and resolving network issues by analyzing the map.
- Documentation. Creating comprehensive network documentation for reference and maintenance.
- Security Planning. Assessing security vulnerabilities and implementing appropriate measures.
- Capacity Planning. Determining the network’s capacity and finding potential bottlenecks.
- Training and Education. Training new administrators and educating other staff about the network infrastructure.
Adhere to these best practices and leverage suitable tools. Then, you can construct comprehensive maps. They will improve communication, streamline processes, and set network performance. These maps serve as invaluable illustrations. They enable stakeholders to:
- Quickly grasp network topology.
- Find potential bottlenecks.
- Proactively fix issues before they escalate.
Also, well-structured maps facilitate effective collaboration among team members. It reduces downtime and cuts the impact of disruptions. So, invest time and effort in creating clear, accurate, and up-to-date network maps. This will help your organization improve network reliability and efficiency.
