Here’s a comprehensive list of diagram types, starting with the most well-known and commonly used, followed by less familiar ones. All of these diagram types are supported by draft1.ai.
Important to note that all the diagrams in this post were generated with draft1.ai and all of them are editable with drawio for final adjustments.
1. Flowchart
- Description: A graphical representation of a process or workflow, using symbols to denote different types of actions or steps.
- Common Uses: Process mapping, decision making, project planning.
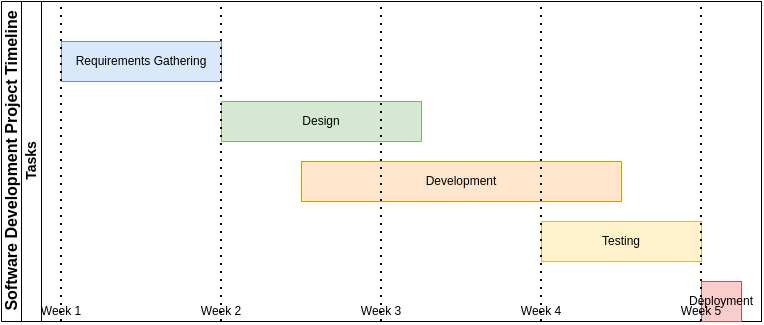
2. Gantt Chart
- Description: A type of bar chart that represents a project schedule, showing the start and finish dates of elements.
- Common Uses: Project management, timeline visualization, task tracking.
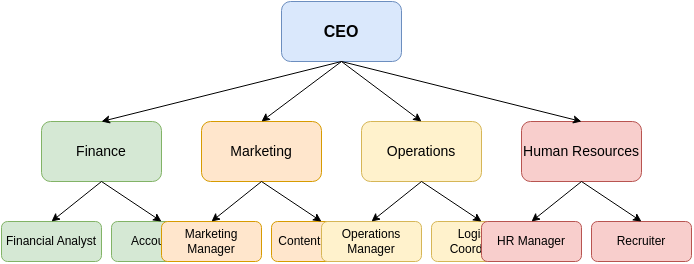
3. Organizational Chart
- Description: A diagram that shows the structure of an organization, typically depicting relationships between employees, departments, and functions.
- Common Uses: HR management, corporate structure visualization.
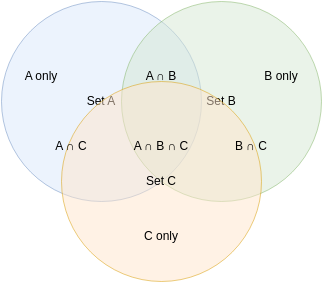
4. Venn Diagram
- Description: A diagram that shows all possible logical relations between a finite collection of different sets.
- Common Uses: Set theory, statistics, logic, and probability.
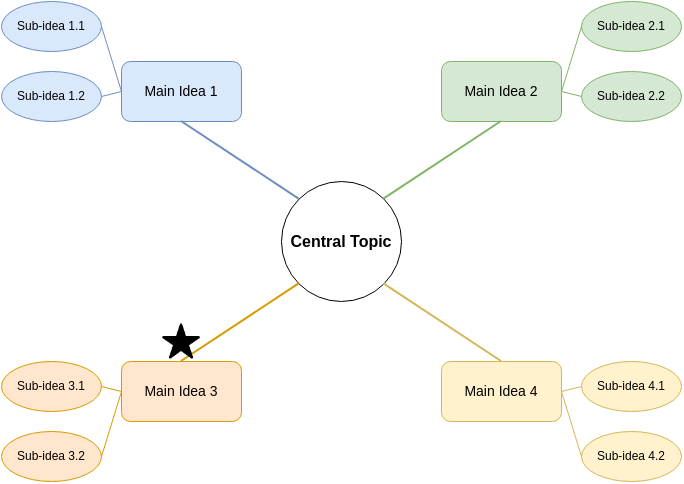
5. Mind Map
- Description: A diagram used to visually organize information, showing relationships among pieces of a whole.
- Common Uses: Brainstorming, idea generation, planning.
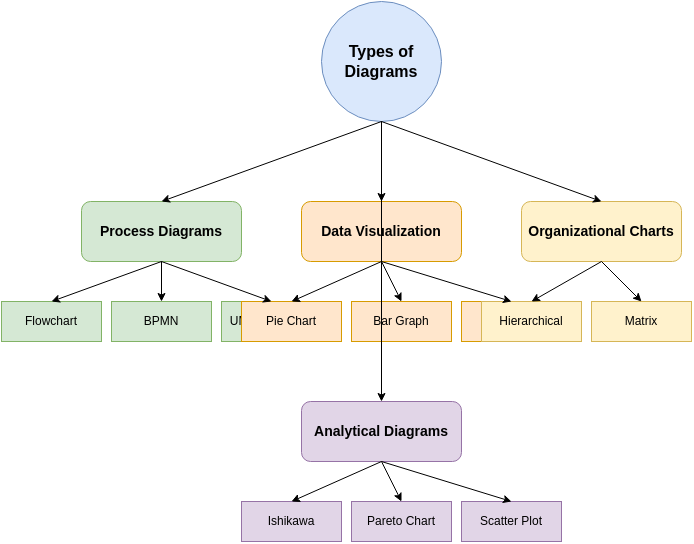
6. Pie Chart
- Description: A circular statistical graphic that is divided into slices to illustrate numerical proportions.
- Common Uses: Data representation, statistical analysis.
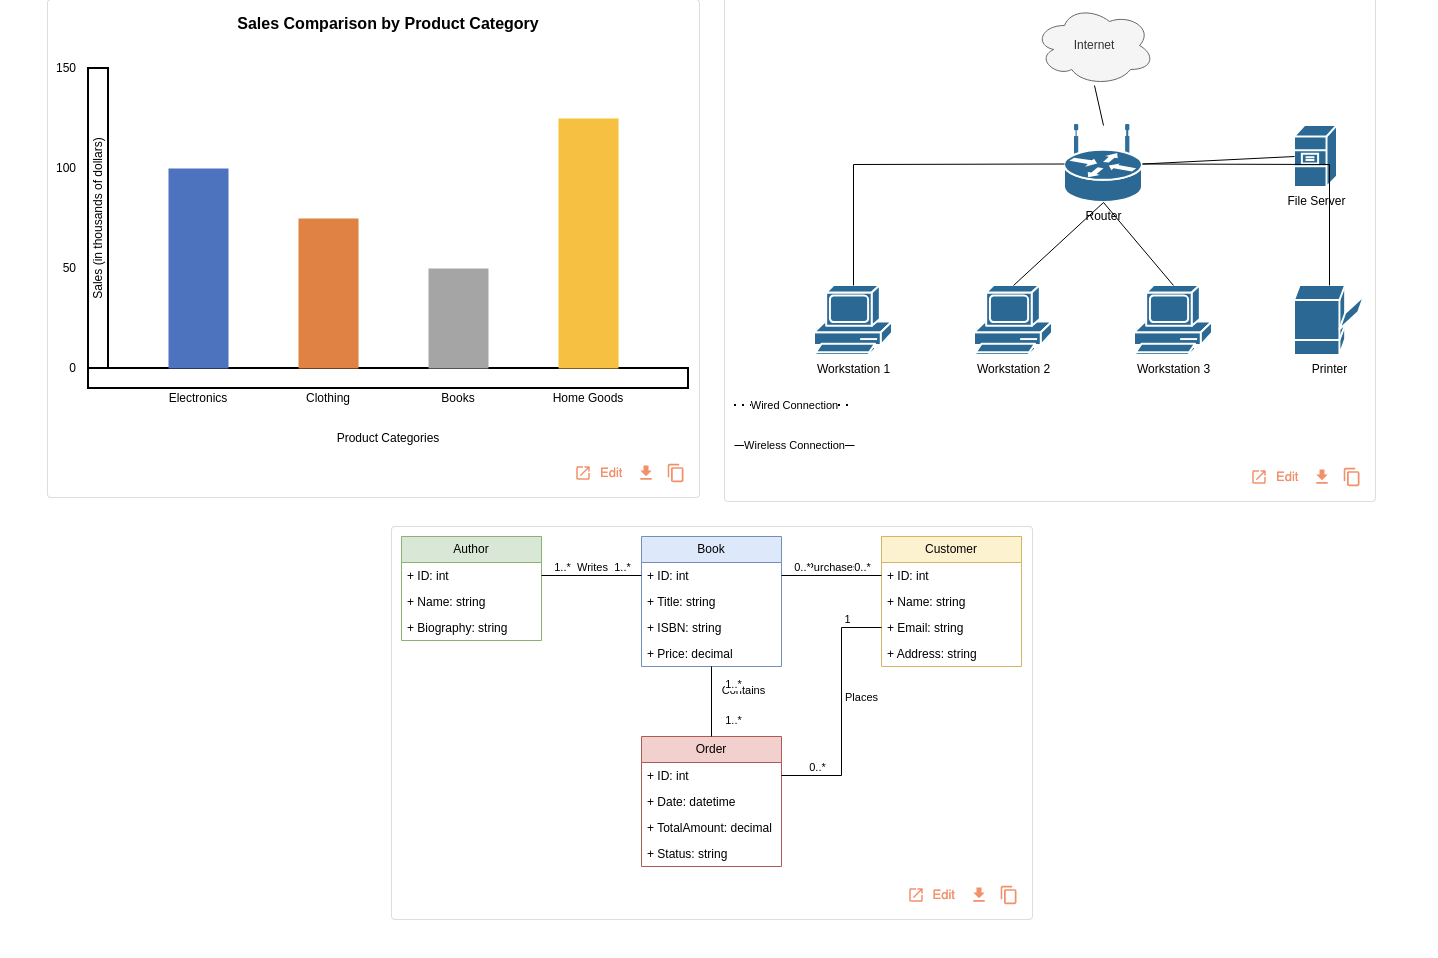
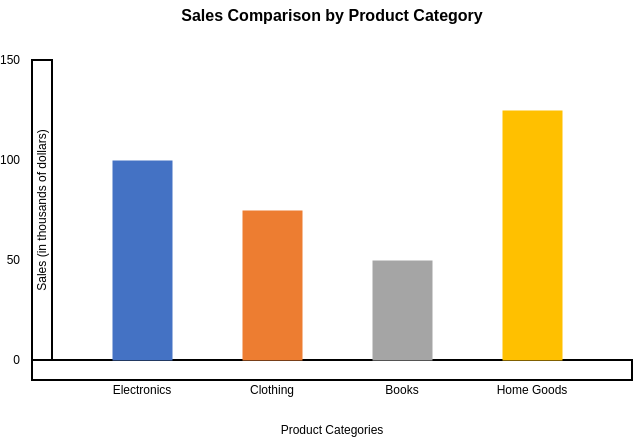
7. Bar Chart
- Description: A chart that presents categorical data with rectangular bars with lengths proportional to the values they represent.
- Common Uses: Data comparison, trend analysis.
8. Network Diagram
- Description: A diagram that shows the relationships between different entities within a network, such as computers, devices, and their connections.
- Common Uses: IT infrastructure planning, system architecture.

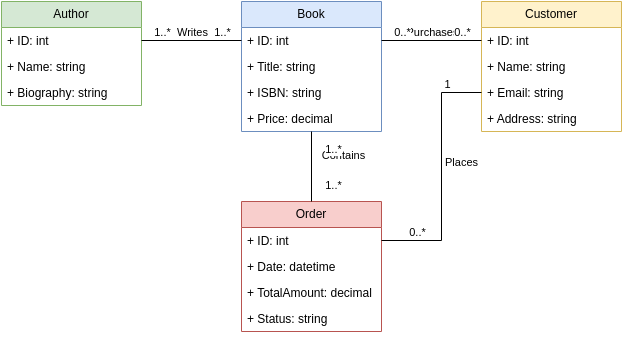
9. ER Diagram (Entity-Relationship Diagram)
- Description: A data modeling technique that graphically illustrates an information system’s entities and the relationships between those entities.
- Common Uses: Database design, software engineering.
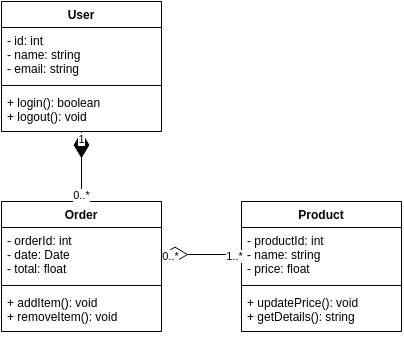
10. UML Diagram (Unified Modeling Language)
- Description: A standardized modeling language used to visualize the design of a system.
- Common Types: Class diagrams, sequence diagrams, use case diagrams, activity diagrams.
- Common Uses: Software development, system design.
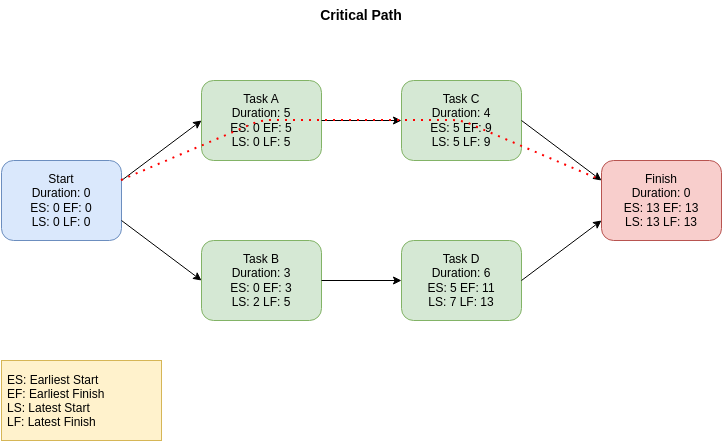
11. PERT Chart (Program Evaluation Review Technique)
- Description: A project management tool used to schedule, organize, and coordinate tasks within a project.
- Common Uses: Project management, task scheduling.
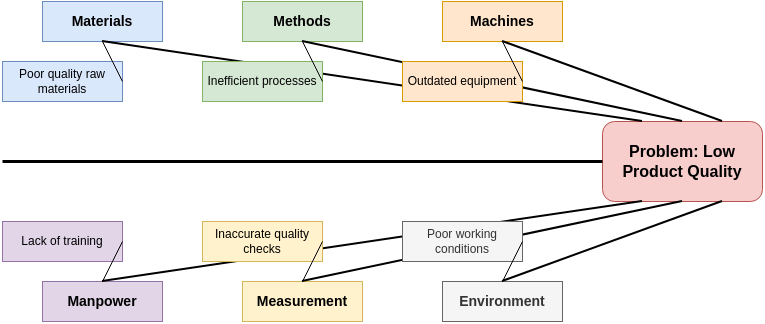
12. Fishbone Diagram (Ishikawa or Cause-and-Effect Diagram)
- Description: A diagram that helps identify, organize, and analyze potential causes of problems.
- Common Uses: Root cause analysis, problem-solving.
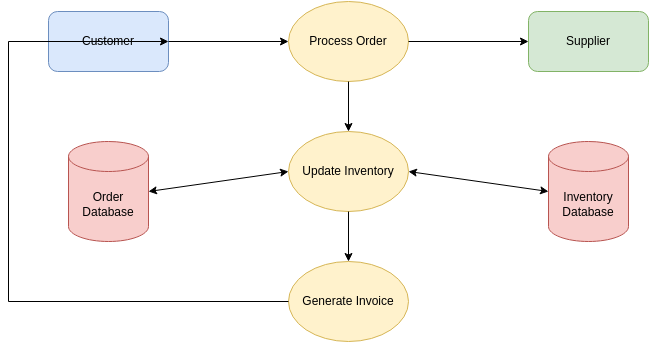
13. Data Flow Diagram (DFD)
- Description: A graphical representation of the flow of data through an information system.
- Common Uses: System analysis, process modeling.
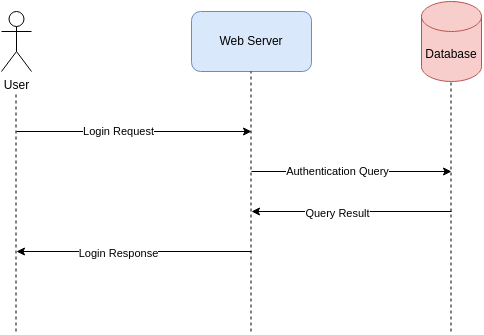
14. Sequence Diagram
- Description: A type of UML diagram that shows how objects interact in a particular sequence.
- Common Uses: Software design, system interactions modeling.
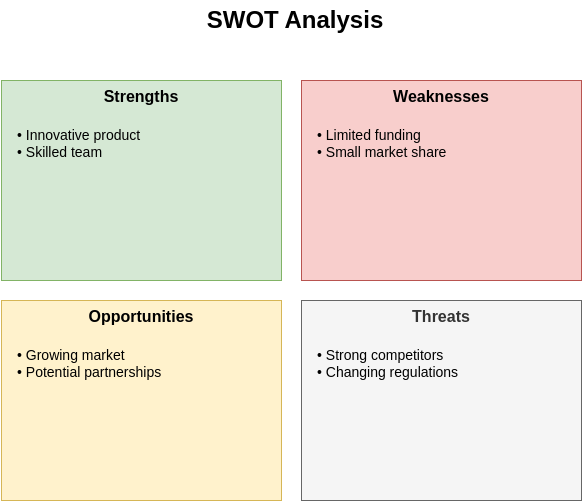
15. SWOT Analysis Diagram
- Description: A framework used to identify and analyze the strengths, weaknesses, opportunities, and threats related to business competition or project planning.
- Common Uses: Strategic planning, business analysis.
This (to be continued) list includes a broad spectrum of diagram types, from the most commonly used to those that are more specialized or niche. Each serves a unique purpose, catering to different fields such as project management, engineering, software development, education, and business analysis.