Venn diagrams are powerful visual tools used to represent relationships between different sets of data. Named after John Venn, a British logician who introduced them in 1880, these diagrams have become an essential part of mathematics, logic, statistics, and data science. In this blog post, we'll explore Venn diagrams in detail, starting with simple examples and progressing to more complex representations.
Basic Two-Set Venn Diagram
Let's begin with the most common type of Venn diagram: the two-set diagram.

This diagram consists of two overlapping circles, each representing a set. The overlapping region, known as the intersection, represents elements common to both sets. Areas outside the intersection represent elements unique to each set.
Example 1: Fruits and Citrus
- Set A: Fruits (apples, oranges, lemons, bananas, grapes)
- Set B: Citrus (oranges, lemons, limes, grapefruits)
In this example, oranges and lemons would be in the intersection, while apples, bananas, and grapes would be in Set A only, and limes and grapefruits in Set B only.
Three-Set Venn Diagram
As we increase complexity, we move to three-set Venn diagrams.
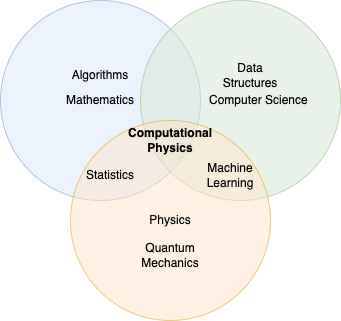
This diagram shows three overlapping circles, creating seven distinct regions:
- Unique to Set A
- Unique to Set B
- Unique to Set C
- Common to A and B, but not C
- Common to A and C, but not B
- Common to B and C, but not A
- Common to all three sets (A, B, and C)
Example 2: Educational Backgrounds
- Set A: People with Science degrees
- Set B: People with Engineering degrees
- Set C: People with Business degrees
This Venn diagram could represent:
- People with only a Science degree (region 1)
- Those with both Science and Engineering degrees (region 4)
- Individuals with all three degrees (region 7)
- And so on for other combinations
Complex Multi-Set Venn Diagrams
For more than three sets, Venn diagrams become increasingly complex and may require alternative representations.

This diagram represents a four-set Venn diagram using ellipses instead of circles. It allows for the visualization of all possible intersections between four sets, resulting in 16 distinct regions.
Example 3: Customer Preferences in an Online Store
- Set A: Customers who bought electronics
- Set B: Customers who bought books
- Set C: Customers who bought clothing
- Set D: Customers who bought home decor
This complex diagram can help visualize various customer segments, such as:
- Customers who bought only electronics (region unique to A)
- Those who purchased electronics and books, but not clothing or home decor
- Customers who bought items from all four categories (central region)
Applications of Venn Diagrams
- Mathematics and Set Theory: Illustrating set operations like union, intersection, and complement.
- Logic and Philosophy: Representing logical relationships and syllogisms.
- Statistics and Probability: Visualizing sample spaces and event probabilities.
- Data Science and Machine Learning: Feature selection and data preprocessing.
- Business and Marketing: Analyzing market segments and product features.
- Biology and Genetics: Comparing gene expressions or species characteristics.
Conclusion
Venn diagrams are versatile tools that can represent simple to highly complex relationships between sets. From basic two-circle diagrams to intricate multi-set representations, they offer a visual way to understand and analyze data across various fields. As we've seen through our examples, Venn diagrams can be applied to a wide range of scenarios, making them an invaluable asset in data visualization and analysis.
Whether you're a student learning about set theory, a data scientist exploring feature interactions, or a business analyst segmenting your market, mastering Venn diagrams can significantly enhance your ability to comprehend and communicate complex relationships within your data.